Often times, in order to make important marketing decisions, companies must go beyond just using data points and present analytical data to clients visually so that they can best digest the information. According to an expert on Research Gate, “Visual analytics is a body of knowledge that allows us to use techniques with interactive visualization algorithms and methods of data analysis in order to support the analytical reasoning for decision making.” Visual analytics is incredibly useful in allowing people to understand and process data using interactive visual interfaces. In  other words, visual analytics makes complex information much easier to understand so that businesses can access data and make decisions quickly. This means businesses can efficiently solve relevant issues like never before.
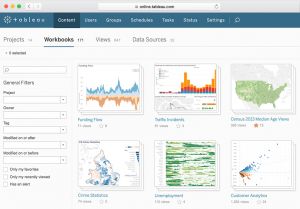
One such visual analytics platform is Tableau. This well-known and widely used software can strengthen a business’s positioning and help them differentiate themselves amongst a sea of competition. Tableau enables users to create dashboards that give actionable insights. The program not only provides many options for displaying information but is really revolutionizing the way in which businesses use data to solve their issues. An article by Guru 99 claims that “Data analysis is very fast with Tableau and the visualizations created are in the form of dashboards and worksheets. The data that is created using Tableau can be understood by professionals at any level in an organization. It even allows a non-technical user to create a customized dashboard.” This is an amazing feat and allows users to put the information into perspective by seeing and understanding data to explore what is really means.
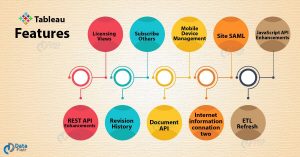
Some features that allow Tableau to be one of the strongest data analysis platforms is not only its ability to provide detailed insights and its user-friendly approach, but the great visualizations and ability to work with different data sources as well. Tableau has built in features that allow users to  work with all types of unordered data and create many varieties of visualizations. Another strong feature is the platform’s ability to work with data regardless of what source it comes from. The tool allows users to connect many different data sources and blend them to create resourceful visualizations. Not to mention, adding data sets is made incredibly easy by using common fields.
Overall, Tableau is an amazing Business intelligence tool for helping analysts break down multifaceted data and solve complex problems via logical visualizations in no time. By simply dragging and dropping information, businesses can even eliminate their dependency on IT technicians and remove unnecessary complications so that the main focus can be finding the value buried in the data.